Context: During the 2000’s there was decline in poverty as was indicated by the Government data. However, now multiple data point to a rise in poverty and unemployment.
What is the Periodic Labour Force Survey?
-
The PLFS is an annual survey conducted by the National Statistical Office (NSO).
-
It was started in 2017, and it essentially maps the state of employment.
-
In doing so, it collects data on variables such as the level of unemployment, the types of employment and their respective shares, etc.
-
Earlier, this job was done by Employment-Unemployment Surveys, but these were conducted once every five years.
-
The PLFS captures key indicators of the labour market such as the Labour Force Participation Rate (LFPR), Worker-Population Ratio (WPR) and Unemployment Rate (UR).
Measurement of Poverty
-
Prior to 2011, PLFS (periodic labour force survey) data was also used to estimate poverty.
-
Household monthly per capita expenditure data was also collected based on Mixed Recall Period methodology.
-
In 2011, the government decided to raise the poverty line as per the recommendations of the Tendulkar committee.
Rise in poverty figures
-
In absence of CES data, PLFS data can be used to estimate poverty.
-
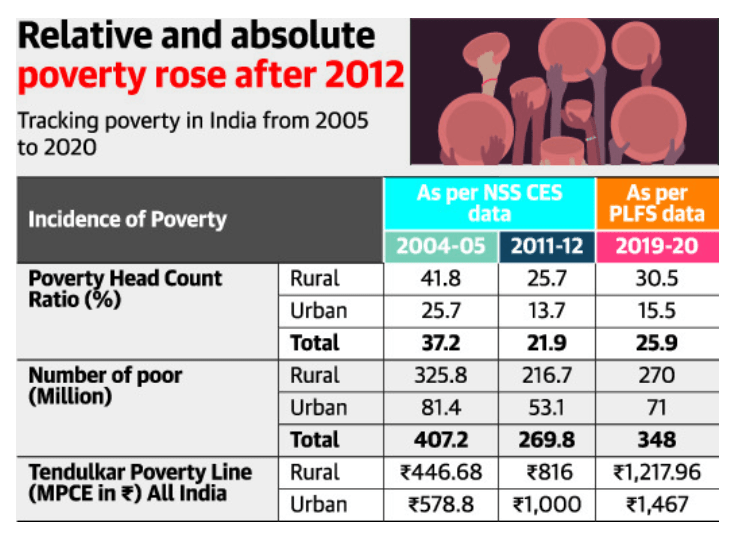
NSO’s CES data 2017 (leaked) showed that rural consumption had fallen by 8% and since over 65% of the population is rural, poverty is estimated to be increased.
-
The absolute number of poor had risen from 217 Mn(2012) to 270 Mn(2019). (first time since history of CES)
Reasons for increased poverty
-
Demonetization and GST reforms struck a heavy blow to the unorganized sector & MSME.
-
Household savings declined, private investment fell from 31% to 28%
-
Public expenditure was constrained by fiscal consolidation
-
Exports fell, in absolute terms
-
There was a rise in unemployment and real wages did not increase.